Introducing the Materials Informatics Platform (MIP)
Demonstrated on Perovskite Solar Cells and Solid-State Batteries

Basila Kattouf, Ph.D. - Customer Success - Materials Zone
Contact: Contact@Materials.Zone, Set a meeting,
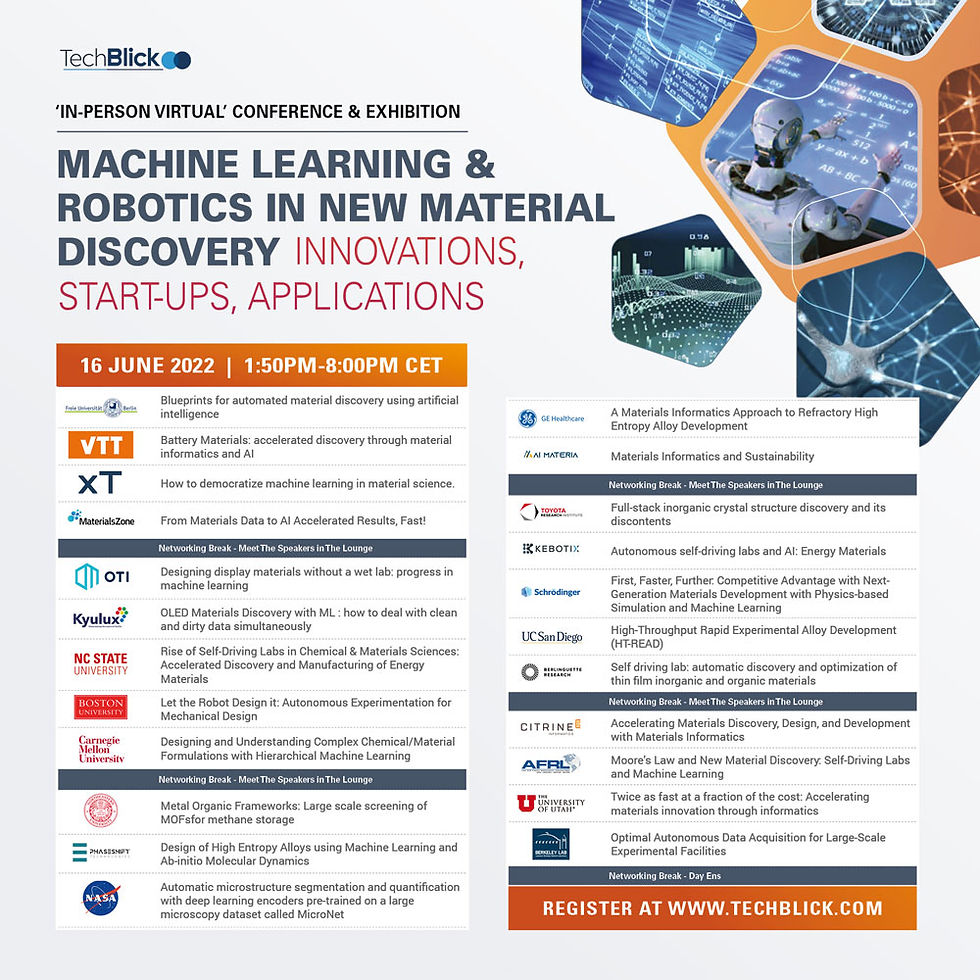
Materials Zone presentation on TechBlick - Thursday, June 16, 2022 14:45-15:05 (CET)
Visit our virtual booth
The Materials Informatics Platform (MIP) Revolution
Materials Zone is a Materials Informatics (AI/ML) Platform or MIP in short. Like the CRM revolution in marketing/sales before it, the MIP is the next organizational platform revolution for materials/products. Powered by AI/ML, it rapidly visualizes all the insights from all the data and serves multiple stakeholders - R&D, supply chain, manufacturing, and business. Thus, it accelerates materials/products innovation from discovery to commercialization.
The MIP ingests multi-dimensional, unstructured, and dispersed materials data and transforms it into ML driven results for R&D, supply chain and manufacturing. It does so rapidly, cost-effectively, and sustainably on a collaborative organizational platform. Materials Zone is domain agnostic and has been proven on solar cells, solid-state batteries, hydrogen technologies, building materials, polymers, 3D printing, alloys, coatings, packaging, healthcare, metrology and more. Follow video links to platform demonstrations in the context of below examples.
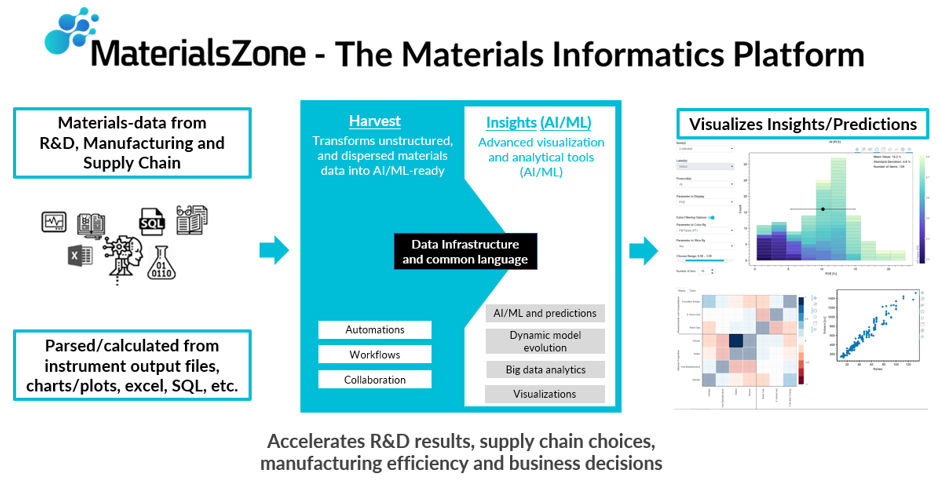
Fig 1: Materials Zone (MIP) - From Raw Data to Rapid Insights - Download short document
We will demonstrate the platform via the perovskite solar cells (PSC) from the perovskite database project (www.perovskitedatabase.com), collected by 98 scientists, hosted on Materials Zone, containing over 42,000 devices extracted from over 15,000 research papers. The PDP was announced in nature energy magazine and enables researchers a better starting point, leveraging accumulated global knowledge. Then we shall augment with a brief demonstration with solid state batteries.
Why are perovskites interesting?
Perovskite Solar Cells (PSC) are predicted to be a disruptive technology in the PV industry as they are able to achieve a very high power conversion efficiency (PCE) increasing from 3.8% in 2009 to 25.7% in 2022 (https://www.science.org/doi/10.1126/science.abh1885). High efficiency, combined with the lightweight, flexible nature (having 1/10th of the weight per square meter as silicon) makes PSCs very attractive. Rethink Energy predicts PSCs can achieve 7% of global photovoltaic market share by 2025, increasing to >29% by 2030 (assuming predicted efficiency will increase by 30% and costs reduced by up to 50%). Allied Market Research estimates that global Perovskite solar cell market size will reach $6.6 billion by 2030, growing at a CAGR of 32.4% from 2021 to 2030.
A typical PSC is composed of five main building blocks:
Transparent Conductive Oxide (TCO).
Electron Transporting Layer (ETL).
Perovskite.
Hole Transporting Layer (HTL).
Back contact.
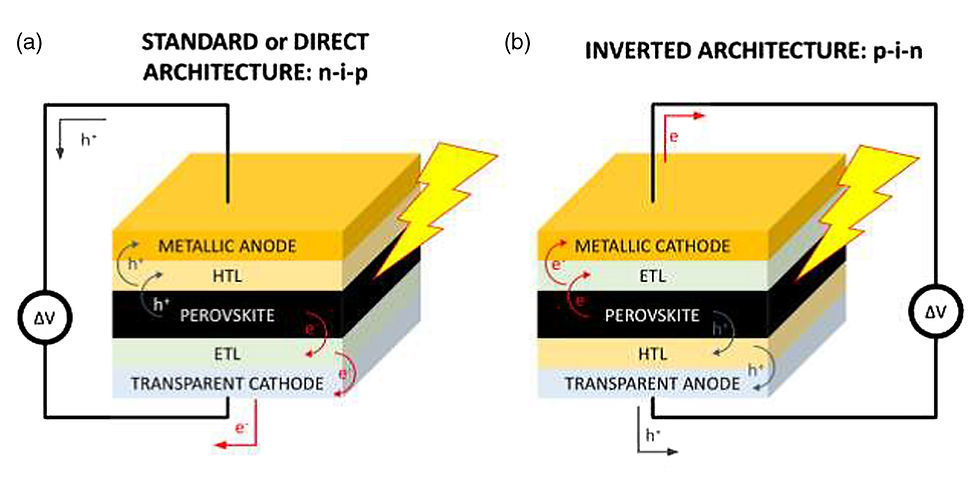
Fig 2: A typical PSC stack; (a) direct architecture, (b) inverted architecture. Image credit: https://doi.org/10.1021/acsami.5b01049
The performance of each PSC device is measured using a solar simulator setup and the 4 main performance indicators (PCE, FF, Voc, Jsc) are calculated/observed from I-V curves.
A day in the lab
The day-to-day R&D activity includes fine tuning of multiple variables per each building block, such as: materials, compositions, deposition techniques, processes, temperature, other parameters etc. The PDP subset we selected, is per a particularly interesting preparation technique, with the 4 performance indicators each dependent on 40 descriptors.
Each one of these 44 indicators and descriptors may be obtained directly from instruments and/or requires additional calculations. For each new sample (solar cell) tested this needs to be repeated.
It is difficult to ascertain a priori, which are the most predictive descriptors, so all 160 (4 times 40) scatter plots need to be created each time a new sample is tested. These need to be reviewed and compared to design the next solar cell test. If not automated, this takes a lot of time/effort and leads to ‘trial-and-error’ instead of deduction.
Hands-free zero-effort data visualization
Materials Zone automates the ingestion of the 44 indicators and descriptors and instantly enables the researchers to visually zoom in on the data and the insights it projects. It indicates the most dominant descriptors by calculating all 160 plots instantaneously with an easily comparative search using the Pearson correlation matrix. Dark red and dark blue “squares” indicate the most significantly correlated plots and they are easily viewed by simply clicking the “square”. It also allows an intelligent “search” through the samples using a histogram view.
This 60 second video shows it all from file ingestion to file visualization to correlation (scatter plot search) to histogram search (flow video)
This allows the researchers to rapidly converge to the optimal solar cell in the following evolutionary cycle. In each step, the researchers define the next test where the data-driven conclusions might be to converge to the optimal design, or that not enough descriptors have been measured, or that there is not enough cell variety in the data set to build a predictive model properly.
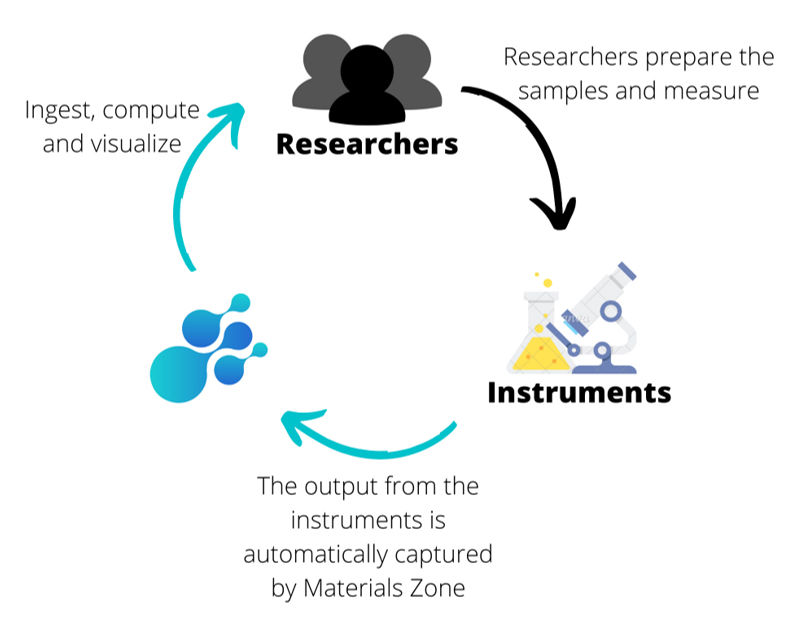
Fig 3: Demonstrating the flow starting from the researchers and back to them. Black arrow describes the jobs that the researchers do while the turquoise arrows describe the jobs that are automatically performed by Materials Zone. Click to view customer testimonial video explaining the above in the context of perovskites research.
Rapid Insights
Manually working on the I-V curves obtained from the solar simulator, then calculating the 4 performance indicators and then plotting 160 charts would take more than a full day of tedious work. Then sifting through those charts to search for insights might take a while longer.
As seen on the demo video, on Materials Zone it took less than a minute to discover the bright red correlation “squares” that immediately pointed to the following charts:
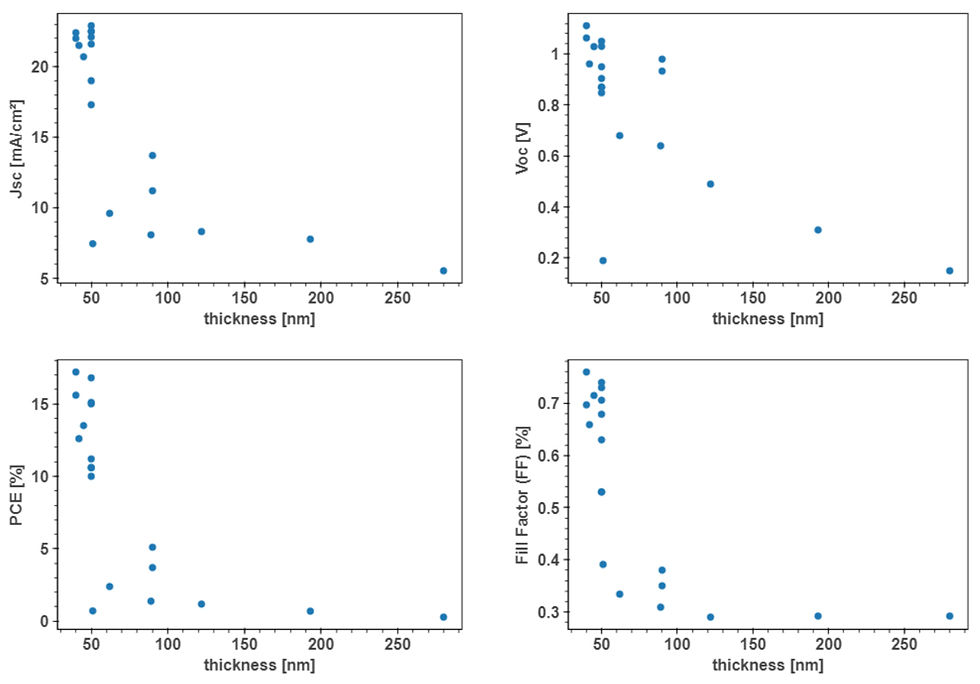
Fig 4: Charts showing the four performance indicators (Jsc, Voc, FF, PCE) vs ETL thickness.
The negative correlation between ETL thickness and PSC performance, per this preparation technique from the Perovskite DB, may or may not surprise researchers. For sure the likely implication is that far thinner ETLs need to be tested to find the optimal thickness and control for other factors. Further Materials Zone modules are required to obtain an accurate predictive model.
Why are Solid-State Batteries interesting?
Solid-state batteries have a promise to have higher energy density than current Li-ion batteries with liquid electrolytes. Furthermore, they don't have the risk of explosion or fire. So in addition to the safety value in itself there is also no need to have components for safety, thus saving even more space. Therefore, especially for EV applications, solid-state battery technology is a leading candidate.
Batteries have at least as many dimensions as PSC. In addition, they need to be tested in very long cycles of repetitive charging and discharging cycles. That’s more data per each sample and more time to conclude sample testing. Thus it is ever more difficult, costly and time consuming to collect, model and analyze this data.
So, in addition to what you have already seen from Materials Zone up until now, please see the following video showing how researchers can rapidly analyze these cycles amongst all batteries tested using analytical tools provided by the platform. Thus accelerating their processes and reducing efforts and elapsed time.

In summation
We have briefly discussed and demonstrated the following:
R&D activities for developing materials-based products (such as solar cells and batteries) is a multi-dimensional problem.
For analyzing multi-dimensional problems efficiently, a holistic view presenting all the dimensions and the correlations between them in a single view is essential.
We have shown how a holistic single view of the project progression can significantly help the researcher make better R&D decisions about next steps.
We demonstrated how the Materials Zone Platform can automate and significantly improve the efficiency (factor of x10) of harvesting, databasing and analyzing R&D data, towards recognizing insightful patterns.



Comentários